Homework 4 solutions#
import numpy as np
import matplotlib.pyplot as plt

# Visualize matrices as a color map
def plot_matrices(A,titles=[]):
    n = len(A)
    if titles==[]:
        titles = [""]*n
    if n>4:
        nx = 4
    else:
        nx = n
    for j in range(int(np.floor(n/4))+1):
        plt.clf()
        plt.figure(figsize=(nx*4,4))
        jmax = 4*(j+1)
        if jmax > n:
            jmax = n
        for i,AA in enumerate(A[4*j:jmax]):
            plt.subplot(1, nx, i+1)
            plt.imshow(AA)
            plt.colorbar()
            plt.title(titles[4*j + i])
        plt.show()
1. More on SVD#
# Visualize matrices as a color map
def plot_matrices(A,titles=[]):
    n = len(A)
    if titles==[]:
        titles = [""]*n
    if n>4:
        nx = 4
    else:
        nx = n
    for j in range(int(np.floor(n/4))+1):
        plt.clf()
        plt.figure(figsize=(nx*4,4))
        jmax = 4*(j+1)
        if jmax > n:
            jmax = n
        for i,AA in enumerate(A[4*j:jmax]):
            plt.subplot(1, nx, i+1)
            plt.imshow(AA)
            plt.colorbar()
            plt.title(titles[4*j + i])
        plt.show()
m=10; n=6

A = np.random.rand(m*n).reshape(m,n)

U, Sdiag, VT = np.linalg.svd(A, full_matrices=False)

plot_matrices([U,VT])

print("Singular values are: ", Sdiag)

Ak = np.zeros((n, m, n))

for k in range(n):
    Ak[k] = np.outer(U[:,k], VT[k,:])

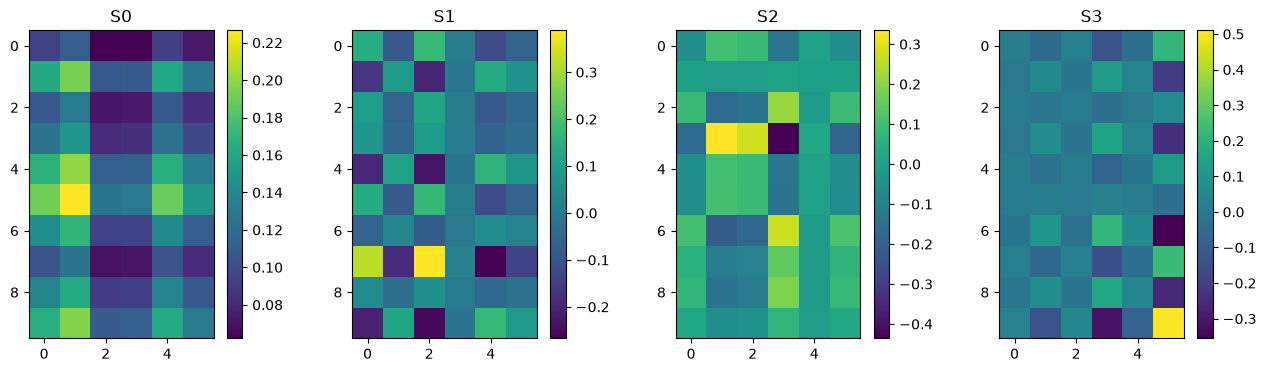
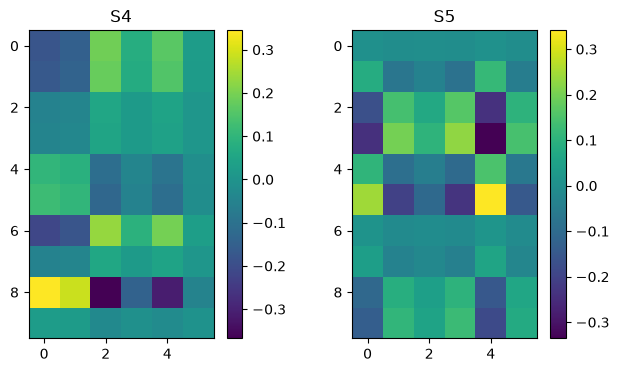
plot_matrices(Ak[:],["S%d" % (i,) for i in range(n)])

Ar = np.zeros_like(A)
for k in range(n):
    Ar = Ar + Sdiag[k] * Ak[k]

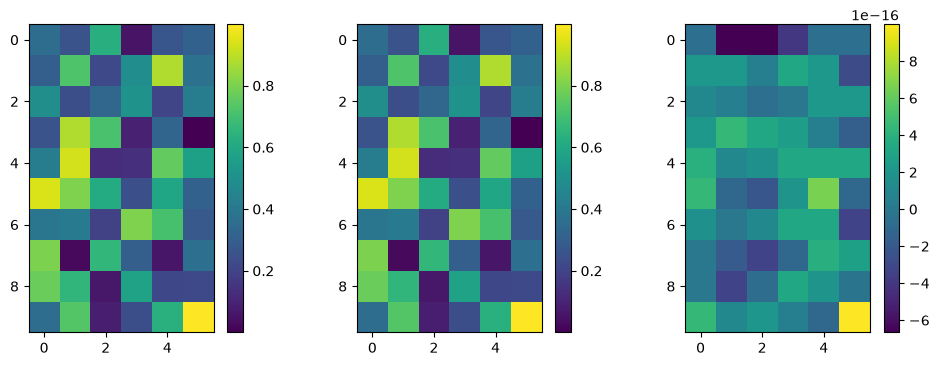
plot_matrices([A, Ar, A-Ar])
<Figure size 640x480 with 0 Axes>
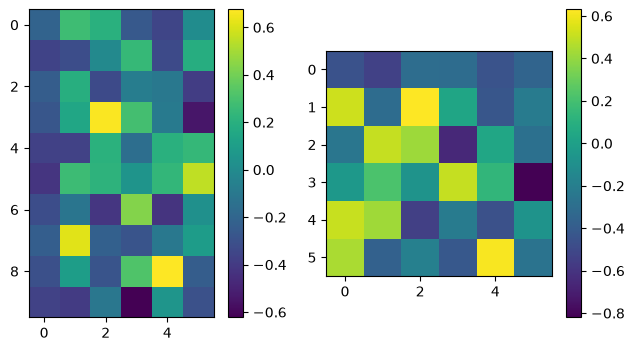
Singular values are: [3.53108347 1.1830942 0.94240142 0.76145774 0.59077482 0.33489094]
<Figure size 640x480 with 0 Axes>
<Figure size 640x480 with 0 Axes>
<Figure size 640x480 with 0 Axes>
from PIL import Image

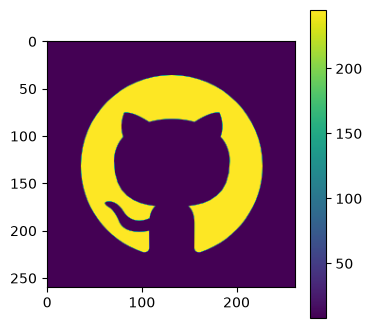
img = Image.open('github_logo.png')
A = np.asarray(img)[:,:,1]
plot_matrices([A])

m,n = np.shape(A)
print('shape = ', m,n)

U, Sdiag, VT = np.linalg.svd(A, full_matrices=False)
nk = len(Sdiag)

plt.clf()
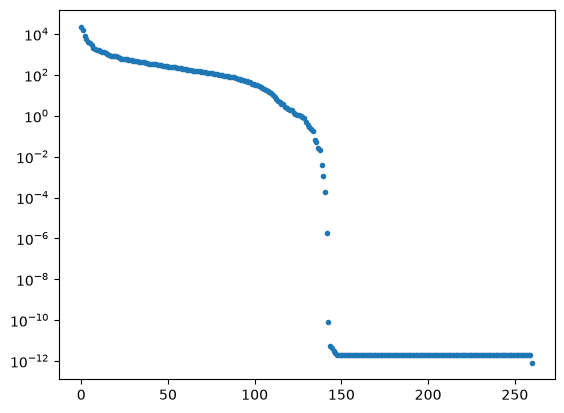
plt.plot(np.linspace(0,nk,nk),Sdiag,'.')
plt.yscale('log')
plt.show()

Ak = np.zeros((n, m, n))

for k in range(nk):
    Ak[k] = np.outer(U[:,k], VT[k,:])

# plot some of the matrices
plot_matrices(Ak[:12],["S%d" % (i,) for i in range(n)])
<Figure size 640x480 with 0 Axes>
shape = 260 262
<Figure size 640x480 with 0 Axes>
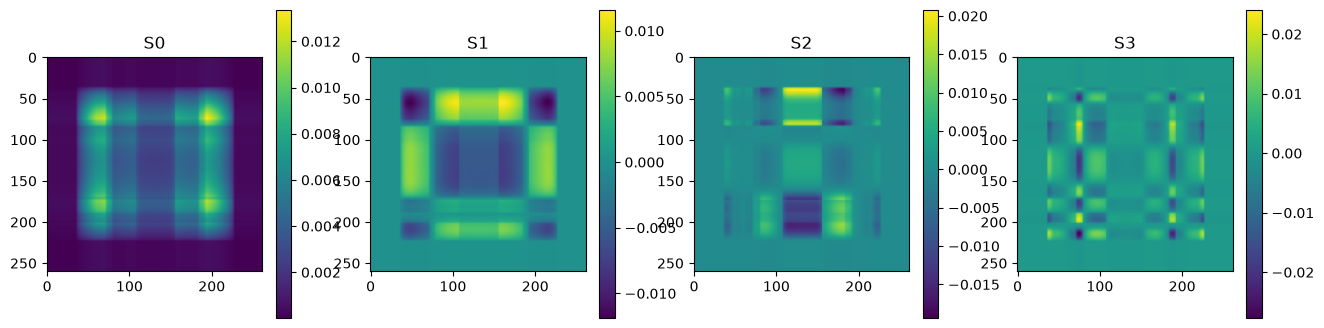
<Figure size 640x480 with 0 Axes>
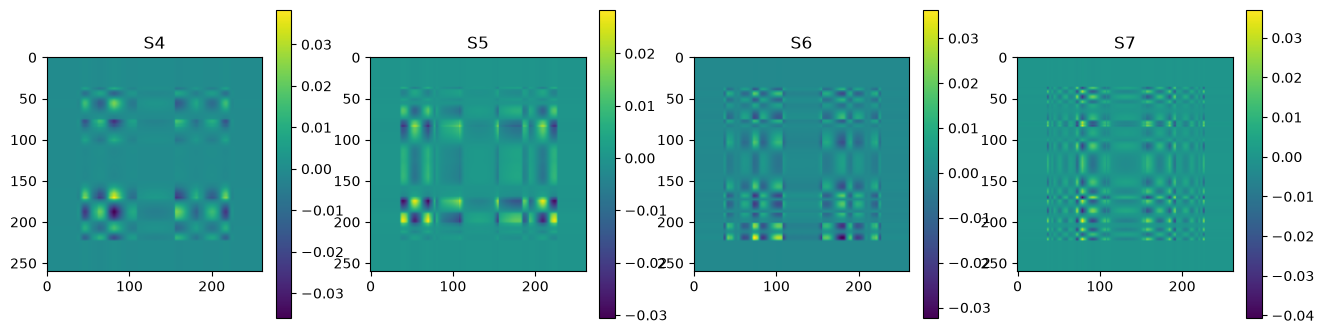
<Figure size 640x480 with 0 Axes>
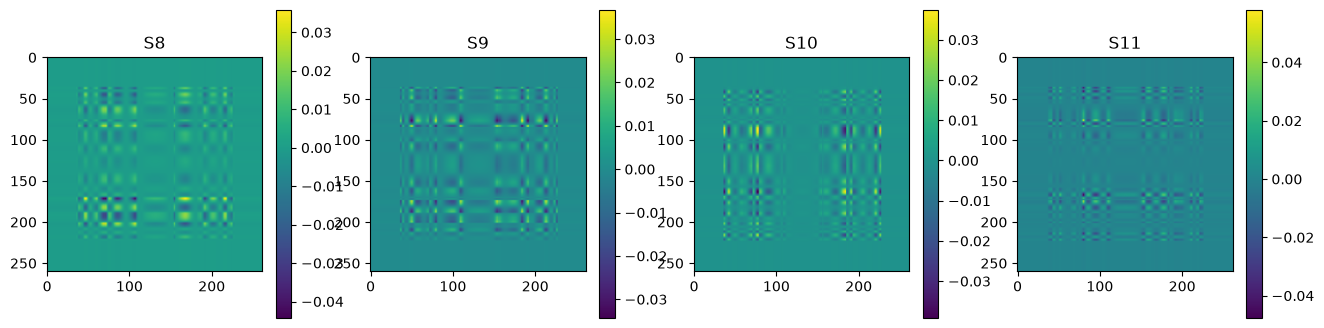
<Figure size 640x480 with 0 Axes>
<Figure size 1600x400 with 0 Axes>
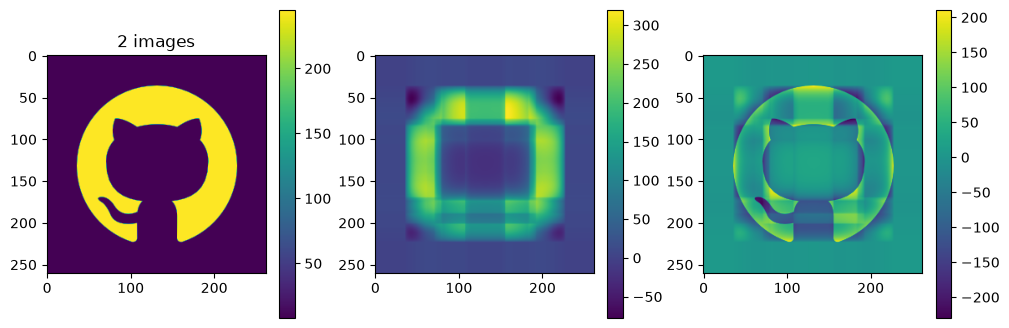
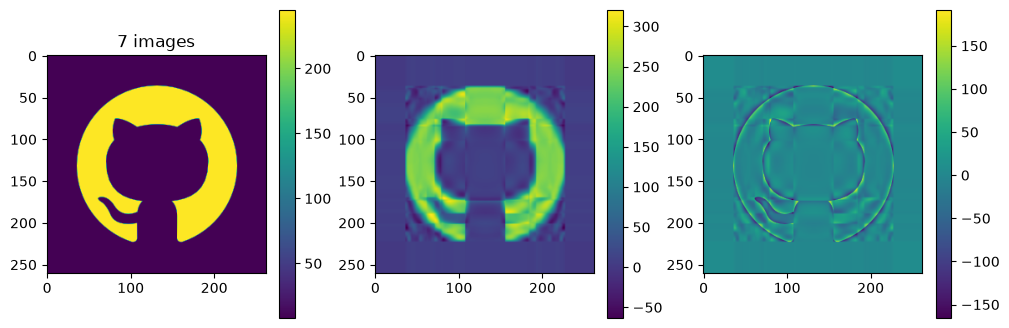
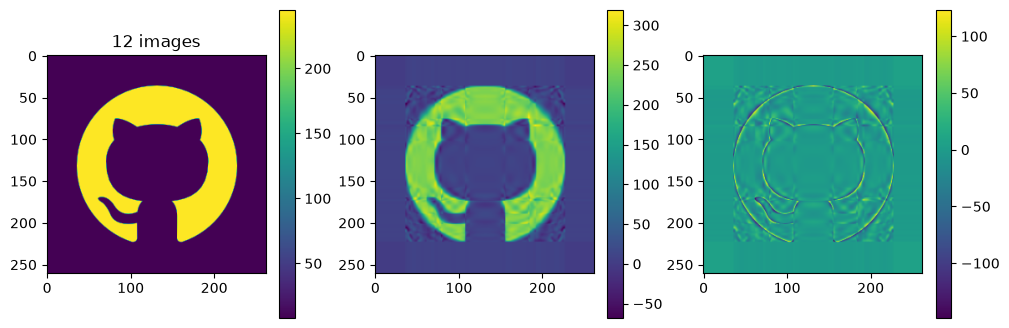
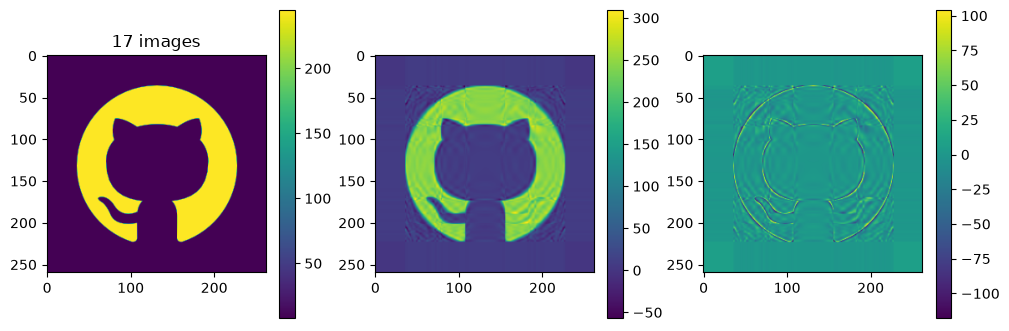
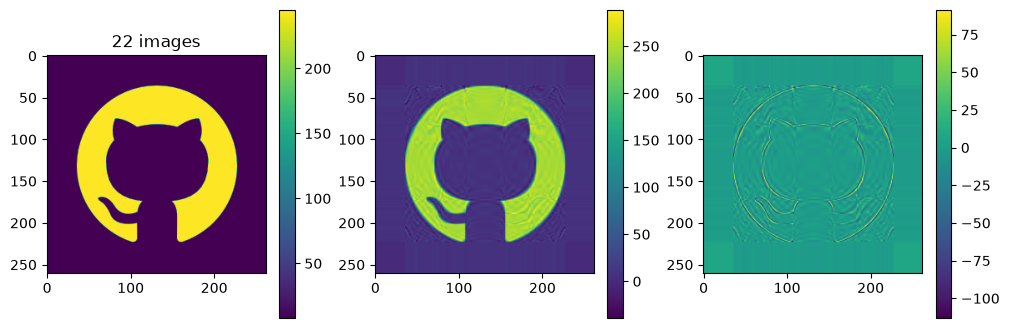
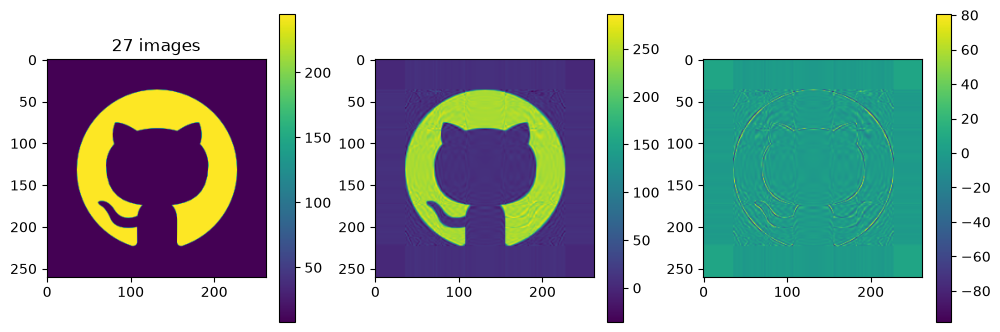
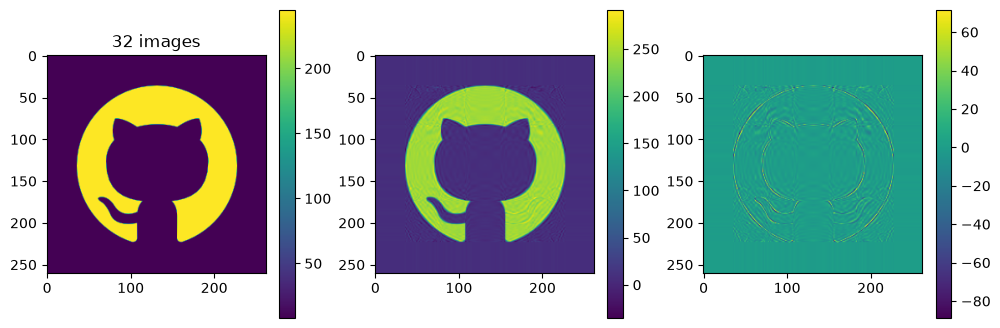
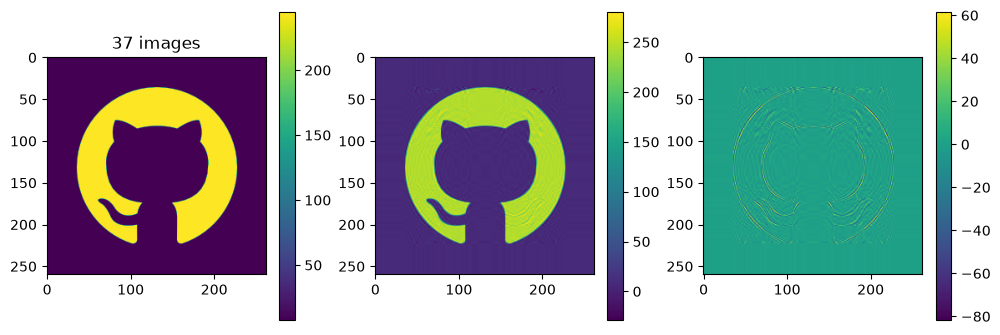
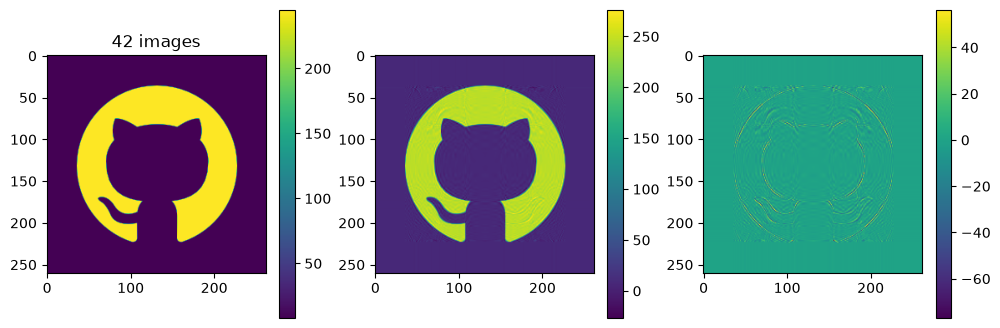
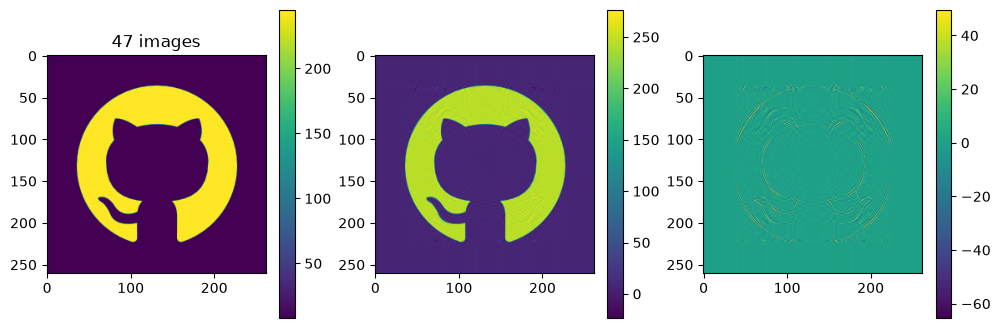
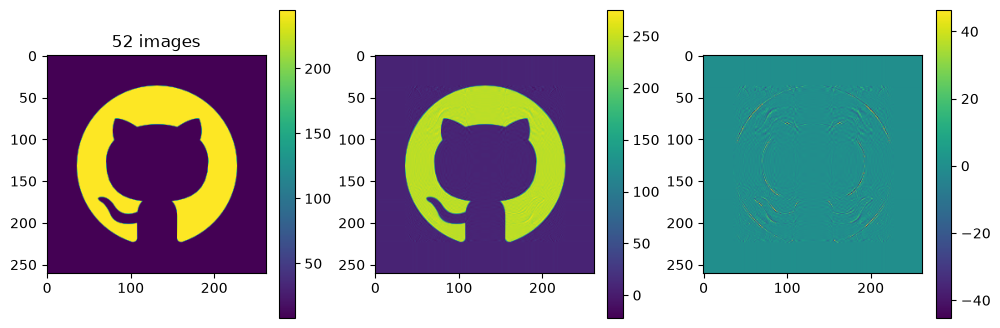
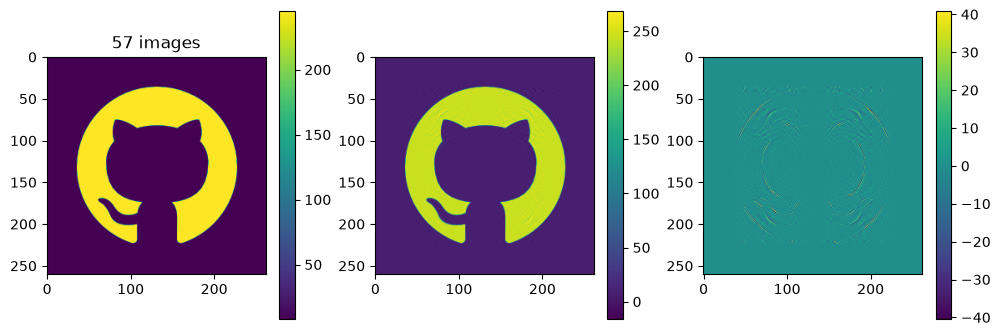
# now show the reconstructed images with different numbers of input matrices
for kmax in range(2,61,5):
    Ar = np.zeros_like(A)
    for k in range(kmax):
        Ar = Ar + Sdiag[k] * Ak[k]
    plot_matrices([A, Ar, A-Ar], titles=["%d images" % (kmax,), "", ""])
<Figure size 640x480 with 0 Axes>
<Figure size 640x480 with 0 Axes>
<Figure size 640x480 with 0 Axes>
<Figure size 640x480 with 0 Axes>
<Figure size 640x480 with 0 Axes>
<Figure size 640x480 with 0 Axes>
<Figure size 640x480 with 0 Axes>
<Figure size 640x480 with 0 Axes>
<Figure size 640x480 with 0 Axes>
<Figure size 640x480 with 0 Axes>
<Figure size 640x480 with 0 Axes>
<Figure size 640x480 with 0 Axes>
print(len(U[:,0]), len(VT[0,:]), nk)
260 262 260
print(20 * (1+260+262), 260*262, (262*260)/(20 * (1+260+262)))
10460 68120 6.512428298279159
Each of the component matrices is constructed from two vectors of length \(m\) and \(n\), so the total storage is \((m+n)\) for those vectors. If we keep \(N\) component matrices, we need \(N\) of these vectors and also \(N\) singular values, ie. a total of \(N(m+n+1)\) numbers. This should be compared to \(m\times n\) for the original matrix.
So in this example, it looks like about 20 components gives a reasonable approximation of the image – so we need \(20\times (1+260+262)=10460\) numbers.
The compression factor is therefore \((260\times 262)/10460\approx 6.5\) compared to storing the full \(m\times n\) matrix.
2. Fitting planetary orbits#
import numpy as np
import matplotlib.pyplot as plt
def rv(t, P, a):
    # Calculates the radial velocity of a star orbited by a planet
    # at the times in the vector t

    # extract the orbit parameters
    # P, t and tp in days, mp in Jupiter masses, v0 in m/s
    mp, e, omega, tp, v0 = a

    # mean anomaly
    M = 2*np.pi * (t-tp) / P

    # velocity amplitude
    K = 204 * P**(-1/3) * mp  / np.sqrt(1.0-e*e) # m/s

    # solve Kepler's equation for the eccentric anomaly E - e * np.sin(E) = M
    # Iterative method from Heintz DW, "Double stars", Reidel, 1978
    # first guess
    E = M + e*np.sin(M)  + ((e**2)*np.sin(2*M)/2)
    while True:
        E0 = E
        M0 = E0 - e*np.sin(E0)
        E = E0 + (M-M0)/(1.0 - e*np.cos(E0))
        if np.max(np.abs((E-E0))) < 1e-6:
            break

    # evaluate the velocities
    theta = 2.0 * np.arctan( np.sqrt((1+e)/(1-e)) * np.tan(E/2))
    vel = v0 + K * ( np.cos(theta + omega) + e * np.cos(omega))

    return vel
def rv_model(t, P, a):
    v = rv(t, P, a)
    A =  np.zeros([len(t), len(a)])
    eps = 1e-8
    b = np.copy(a) * (1 + eps)
    v0 = rv(t, P, np.array([b[0],a[1],a[2],a[3],a[4]]))
    v1 = rv(t, P, np.array([a[0],b[1],a[2],a[3],a[4]]))
    v2 = rv(t, P, np.array([a[0],a[1],b[2],a[3],a[4]]))
    v3 = rv(t, P, np.array([a[0],a[1],a[2],b[3],a[4]]))
    v4 = rv(t, P, np.array([a[0],a[1],a[2],a[3],b[4]]))
    A[:, 0] = (v0 - v) / (b[0]-a[0])
    A[:, 1] = (v1 - v) / (b[1]-a[1])
    A[:, 2] = (v2 - v) / (b[2]-a[2])
    A[:, 3] = (v3 - v) / (b[3]-a[3])
    A[:, 4] = (v4 - v) / (b[4]-a[4])
    return v, A
# Observations
# These are for HD145675 from Butler et al. 2003
tobs, vobs, eobs = np.loadtxt('rvs.txt', unpack=True)

# initial guess
# P, mp, e, omega, tp, v0
P = 1724
a0 = np.array([1.0, 1e-3, 1e-3, 1e-3, 1e-3])

a = a0
err = 1.0
lam = 1e-3
while err > 1e-6:
    v, A = rv_model(tobs, P, a)
    A[:, 0] = A[:, 0] / eobs
    A[:, 1] = A[:, 1] / eobs
    A[:, 2] = A[:, 2] / eobs
    A[:, 3] = A[:, 3] / eobs
    A[:, 4] = A[:, 4] / eobs
    r = (v-vobs)/eobs
    lhs = A.T@A
    lhs = lhs@(np.identity(len(a))*(1+lam))
    rhs = -A.T@r
    da = np.linalg.inv(lhs)@rhs
    # artificially reduce the step to not overshoot e=1
    a1 = a + 0.2*da
    #print(a1, a)
    v1, A1 = rv_model(tobs, P, a1)
    A1[:, 0] = A1[:, 0] / eobs
    A1[:, 1] = A1[:, 1] / eobs
    A1[:, 2] = A1[:, 2] / eobs
    A1[:, 3] = A1[:, 3] / eobs
    A1[:, 4] = A1[:, 4] / eobs
    r1 = (v1-vobs)/eobs
    err = np.sum(r**2)
    err1 = np.sum(r1**2)
    print("err = %lg, a=(%lg, %lg, %lg, %lg, %lg), lam = %lg" % (err1 ,a1[0], a1[1], a1[2], a1[3], a1[4], lam))
    if err1 > err:
        lam = lam * 10
    else:
        lam = lam / 10
        a = a1
        if (err-err1) < 0.1:
            break

print("Best-fit parameters: M = %lg, e = %lg, omega = %lg, tP = %lg, v0 = %lg " %
      (a[0], a[1], a[2] % np.pi, a[3], a[4]))
err = 27352.5, a=(0.783054, -0.369287, 1.4289, 130.96, -5.54259), lam = 0.001
err = 19589.1, a=(1.4266, -0.147589, 3.32163, 433.31, -9.33025), lam = 0.0001
err = 12324.8, a=(2.08735, -0.28571, 3.82486, 595.558, -13.0721), lam = 1e-05
err = 7947.47, a=(2.62761, -0.3021, 3.55111, 527.698, -16.1418), lam = 1e-06
err = 5093.52, a=(3.07083, -0.323861, 3.47471, 509.19, -18.606), lam = 1e-07
err = 3275.93, a=(3.42746, -0.33676, 3.4445, 502.037, -20.5762), lam = 1e-08
err = 2117.05, a=(3.71336, -0.344832, 3.42891, 498.392, -22.1519), lam = 1e-09
err = 1377.17, a=(3.9423, -0.350217, 3.41967, 496.249, -23.4123), lam = 1e-10
err = 904.418, a=(4.12553, -0.353983, 3.41372, 494.877, -24.4206), lam = 1e-11
err = 602.192, a=(4.27215, -0.356707, 3.40969, 493.949, -25.2273), lam = 1e-12
err = 408.921, a=(4.38944, -0.358727, 3.40686, 493.297, -25.8727), lam = 1e-13
err = 285.299, a=(4.48327, -0.360252, 3.40481, 492.827, -26.3891), lam = 1e-14
err = 206.214, a=(4.55833, -0.36142, 3.4033, 492.481, -26.8022), lam = 1e-15
err = 155.617, a=(4.61837, -0.362325, 3.40218, 492.222, -27.1327), lam = 1e-16
err = 123.242, a=(4.6664, -0.36303, 3.40133, 492.027, -27.3972), lam = 1e-17
err = 102.526, a=(4.70481, -0.363584, 3.40069, 491.879, -27.6088), lam = 1e-18
err = 89.2691, a=(4.73553, -0.364022, 3.40019, 491.765, -27.7781), lam = 1e-19
err = 80.7857, a=(4.76011, -0.364369, 3.39981, 491.677, -27.9135), lam = 1e-20
err = 75.3567, a=(4.77976, -0.364644, 3.39952, 491.609, -28.0219), lam = 1e-21
err = 71.8823, a=(4.79548, -0.364864, 3.39929, 491.557, -28.1086), lam = 1e-22
err = 69.6587, a=(4.80806, -0.365039, 3.39911, 491.516, -28.178), lam = 1e-23
err = 68.2357, a=(4.81811, -0.365179, 3.39898, 491.484, -28.2335), lam = 1e-24
err = 67.325, a=(4.82616, -0.365292, 3.39887, 491.459, -28.278), lam = 1e-25
err = 66.7421, a=(4.83259, -0.365382, 3.39879, 491.44, -28.3135), lam = 1e-26
err = 66.369, a=(4.83773, -0.365454, 3.39872, 491.424, -28.3419), lam = 1e-27
err = 66.1303, a=(4.84185, -0.365512, 3.39867, 491.413, -28.3647), lam = 1e-28
err = 65.9775, a=(4.84514, -0.365558, 3.39863, 491.403, -28.3829), lam = 1e-29
err = 65.8797, a=(4.84777, -0.365596, 3.3986, 491.396, -28.3975), lam = 1e-30
Best-fit parameters: M = 4.84777, e = -0.365596, omega = 0.257008, tP = 491.396, v0 = -28.3975
t = np.linspace(tobs[0], tobs[-1], 1000)
plt.plot(t, rv(t,P, a), 'C0')
plt.plot(tobs, vobs, 'C1.')
plt.errorbar(tobs, vobs, eobs, fmt='none', ecolor='C1')
plt.ylabel(r'$v$')
plt.xlabel(r'$t$')
plt.show()
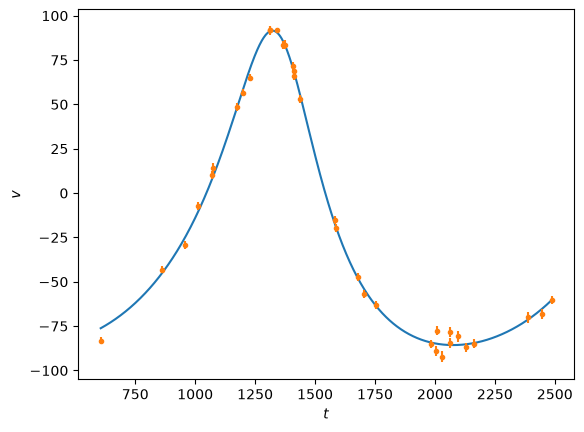
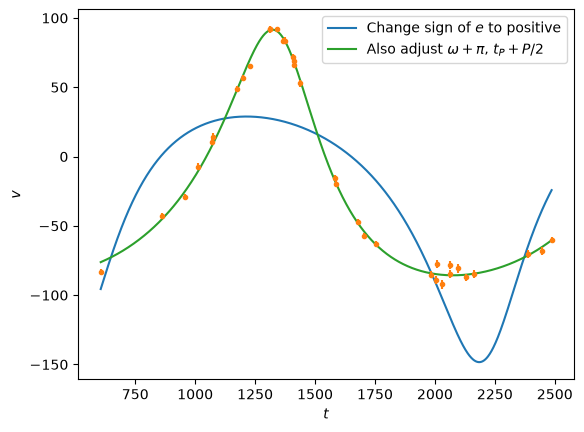
Note that the eccentricity from the fit comes out negative, this is because of a degeneracy between \(e\) and the angles \(\omega_P\) and \(t_P\). By adjusting these, we can fix the eccentricity to be positive:
t = np.linspace(tobs[0], tobs[-1], 1000)

# Change the sign of eccentricity
a2 = np.copy(a)
a2[1] = -a[1]
plt.plot(t, rv(t,P, a2), 'C0', label=r'Change sign of $e$ to positive')

a3 = np.copy(a)
a3[1] = -a[1]
a3[3] = (a[3] + P/2) % P
a3[2] = (a[2] + np.pi) % (2*np.pi)

plt.plot(t, rv(t,P, a3), 'C2', label=r'Also adjust $\omega+\pi$, $t_P+P/2$')

plt.plot(tobs, vobs, 'C1.')
plt.errorbar(tobs, vobs, eobs, fmt='none', ecolor='C1')
plt.ylabel(r'$v$')
plt.legend()
plt.xlabel(r'$t$')
plt.show()
# Calculate the covariance matrix

v, A = rv_model(tobs, P, a3)

A[:, 0] = A[:, 0] / eobs
A[:, 1] = A[:, 1] / eobs
A[:, 2] = A[:, 2] / eobs
A[:, 3] = A[:, 3] / eobs
A[:, 4] = A[:, 4] / eobs

C = np.linalg.inv(A.T@A)
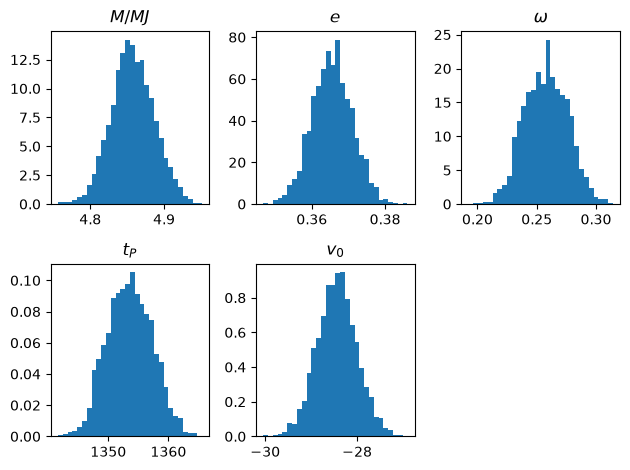
To compare with MCMC, let’s regenerate the samples (I copied the code directly from the exercise here: https://andrewcumming.github.io/phys512/metropolis_solutions.html)
seed = 56123
rng = np.random.default_rng(seed)

def f(x, tobs, vobs, eobs):
    chisq = np.sum(((vobs-rv(tobs, P, x))/eobs)**2)
    return -chisq/2

# Observations
# These are for HD145675 from Butler et al. 2003
tobs, vobs, eobs = np.loadtxt('rvs.txt', unpack=True)

# Number of samples to generate
N = 10**5
x = np.zeros((N, 5))

# initial guess
# P, mp, e, omega, tp, v0
P = 1724
x[0] = [1.0, 0.0, 0.0, 0.0, 0.0]
# and the widths for the jumps
widths = (0.03, 0.03, 0.03, 3.0, 1.0)

count = 0

for i in range(N-1):

    # Proposal
    ii = np.random.randint(0, 5)
    x_try = np.copy(x[i])
    x_try[ii] += rng.normal(scale = widths[ii])

    #x_try[2] = (x_try[2]) % 1   # keep e between zero and 1

    # Accept the move or stay where we are
    u = rng.uniform()
    if u <= np.exp(f(x_try, tobs,vobs,eobs) - f(x[i], tobs,vobs,eobs)):
        x[i+1] = np.copy(x_try)
        count = count + 1
    else:
        x[i+1] = np.copy(x[i])

print("Acceptance fraction = %g" % (count/N,))

# Reject the burn in phase
x = x[int(0.3*N):]

# Move the angles to within 0 to 2pi
x[:,2] = x[:,2] % (2*np.pi)
x[:,3] = x[:,3] % P
Acceptance fraction = 0.3967
# Plot to make sure everything looks ok

titles = (r'$M/MJ$', r'$e$', r'$\omega$', r'$t_P$', r'$v_0$')
for i, title in enumerate(titles):
    plt.subplot(2,3,i+1)
    plt.title(title)
    plt.hist(x[:, i], density=True, bins=30)
plt.tight_layout()
plt.show()
# compare with the least squares results
print('%12s %12s %12s %12s %12s %12s' % ('parameter', 'MCMC', 'LS', 'MCMC var', 'LS var', 'frac diff'))
for i in range(5):
    print("%12s %12lg %12lg %12lg %12lg %12lg" %
          (titles[i], np.mean(x[:,i]), a3[i], np.var(x[:,i]), C[i,i],
            np.divide(np.var(x[:,i]) - C[i,i], np.var(x[:,i]) + C[i,i])))
   parameter         MCMC           LS     MCMC var       LS var    frac diff
      $M/MJ$      4.85764      4.84777  0.000842052  0.000848373   -0.0037391
         $e$     0.365536     0.365596  3.02334e-05  2.87974e-05    0.0243251
    $\omega$     0.257808     0.257008  0.000331497  0.000377659   -0.0650944
       $t_P$      1353.59       1353.4      13.9013      16.2083   -0.0766174
       $v_0$     -28.4376     -28.3975     0.188001     0.183564    0.0119409
Good agreement! Let’s also check the full covariance matrix:
C_mcmc = np.cov(x.T)

with np.printoptions(precision=3, suppress=False):
    print(C,"\n\n",C_mcmc)

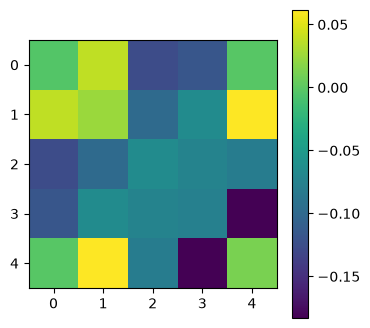
plot_matrices([np.divide(C_mcmc-C, C_mcmc+C)])
[[ 8.484e-04 -6.039e-05 -5.154e-05 -1.316e-02 -4.161e-03]
 [-6.039e-05  2.880e-05 -8.178e-06 -2.969e-03 -3.427e-04]
 [-5.154e-05 -8.178e-06  3.777e-04  7.292e-02  4.868e-04]
 [-1.316e-02 -2.969e-03  7.292e-02  1.621e+01  6.860e-02]
 [-4.161e-03 -3.427e-04  4.868e-04  6.860e-02  1.836e-01]]

 [[ 8.421e-04 -6.520e-05 -4.001e-05 -1.040e-02 -4.147e-03]
 [-6.520e-05  3.023e-05 -6.711e-06 -2.606e-03 -3.876e-04]
 [-4.001e-05 -6.711e-06  3.315e-04  6.293e-02  4.147e-04]
 [-1.040e-02 -2.606e-03  6.293e-02  1.390e+01  4.737e-02]
 [-4.147e-03 -3.876e-04  4.147e-04  4.737e-02  1.880e-01]]
<Figure size 640x480 with 0 Axes>