Matrices in numpy#
We’re going to be dealing with matrices quite a bit in this section, so let’s have a review of how numpy handles matrices.
import numpy as np
import matplotlib.pyplot as plt
# Matrices are 2D arrays in numpy
# A[i][j] = ith row and jth column
A = np.random.rand(12).reshape(4,3)
print(A)
print(A[1])
print(A[1][2])
print(A[1,2])
[[0.06852705 0.74391489 0.23953935]
 [0.32937675 0.7013033  0.91714369]
 [0.73290602 0.65525403 0.3979089 ]
 [0.25337609 0.13575053 0.77900822]]
[0.32937675 0.7013033  0.91714369]
0.917143690838843
0.917143690838843
# Can also use np.transpose(A)  or  A.T
A.transpose()
array([[0.06852705, 0.32937675, 0.73290602, 0.25337609],
       [0.74391489, 0.7013033 , 0.65525403, 0.13575053],
       [0.23953935, 0.91714369, 0.3979089 , 0.77900822]])
# Matrix multiplication uses the @ operator
y = np.array((1,2,3))
A@y
array([2.27497488, 4.48341443, 3.23714079, 2.86190179])
# Diagonal matrix
np.diag((1,2,3,4))
array([[1, 0, 0, 0],
       [0, 2, 0, 0],
       [0, 0, 3, 0],
       [0, 0, 0, 4]])
# Inverse
np.linalg.inv((np.diag((1,2,3,4))))
array([[1.        , 0.        , 0.        , 0.        ],
       [0.        , 0.5       , 0.        , 0.        ],
       [0.        , 0.        , 0.33333333, 0.        ],
       [0.        , 0.        , 0.        , 0.25      ]])
A = np.random.rand(4).reshape(2,2)
B = np.linalg.inv(A)
B@A
array([[ 1.00000000e+00, -7.93806011e-17],
       [ 5.94997719e-17,  1.00000000e+00]])
# Determinant
print(np.linalg.det(A))
print(A[0,0]*A[1,1] - A[0,1]*A[1,0])
0.12030041848617658
0.12030041848617662
# should be 1 * 2 * 3 * 4 = 24
np.linalg.det(np.diag((1,2,3,4)))
np.float64(23.999999999999993)
Matrix decompositions#
# We need scipy.linalg for eigenvalues
import scipy.linalg

# Visualize matrices as a color map
def plot_matrices(A,titles=[]):
    n = len(A)
    if titles==[]:
        titles = [""]*n
    if n>4:
        nx = 4
    else:
        nx = n
    for j in range(int(np.floor(n/4))+1):
        plt.clf()
        plt.figure(figsize=(nx*4,4))
        jmax = 4*(j+1)
        if jmax > n:
            jmax = n
        for i,AA in enumerate(A[4*j:jmax]):
            plt.subplot(1, nx, i+1)
            plt.imshow(AA)
            plt.colorbar()
            plt.title(titles[4*j + i])
        plt.show()
LU decomposition#
A = np.random.rand(100).reshape(10,10)
P, L, U = scipy.linalg.lu(A)
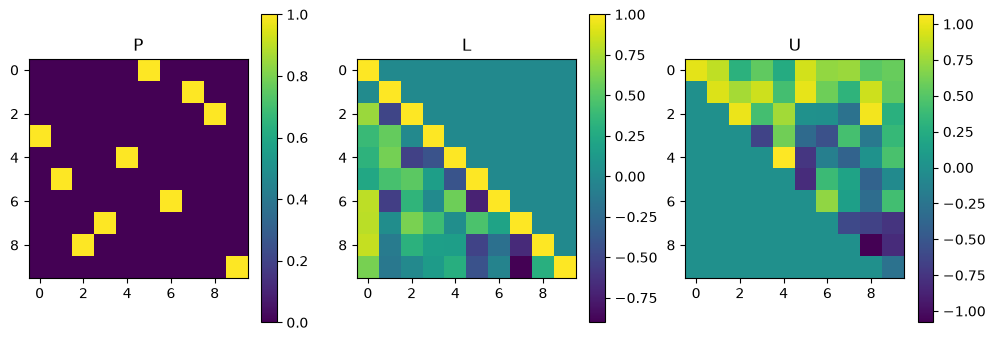
plot_matrices([P, L, U], titles=["P", "L", "U"])
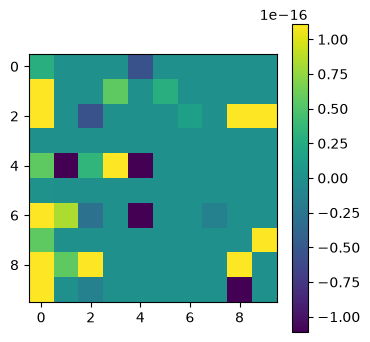
plot_matrices([P@L@U - A])
<Figure size 640x480 with 0 Axes>
<Figure size 640x480 with 0 Axes>
Eigen-decomposition#
The eigenvectors of an \(n\times n\) matrix \(\mathbf{A}\) satisfy
with eigenvalues \(\lambda_i\). Now consider the matrix \(Q\) whose columns correspond to the \(n\) eigenvectors \(\mathbf{v_i}\): you can easily show that this satisfies
where \(\mathbf{\Lambda} = \mathrm{diag}(\lambda_1, \lambda_2\dots \lambda_n)\).
Therefore
which is the eigendecomposition of the matrix.
Since \((\mathbf{A}\mathbf{B}\mathbf{C})^{-1} =\mathbf{C}^{-1}\mathbf{B}^{-1}\mathbf{A}^{-1}\), the inverse of the matrix is
where
# real symmetric matrix
n = 10
A = np.random.rand(n*n).reshape(n,n)
A = 0.5*(A + A.T)
A = A + np.diag(np.arange(n))
lam, Q = scipy.linalg.eig(A)
lam = np.real(lam)
Q = np.real(Q)

print("Eigenvalues=", lam)

print("Eigenvector check:")
for i in range(n):
    # The eigenvectors are given by the columns of Q, ie. Q[:,i]
    print(i, np.max(np.abs(A@Q[:,i]-lam[i]*Q[:,i])))
Eigenvalues= [10.96643212 -0.36040949  8.36782307  1.54113515  2.07079146  7.25974549
  6.16148485  3.71163411  4.54874876  4.99406095]
Eigenvector check:
0 8.215650382226158e-15
1 4.1000189354711836e-15
2 9.71445146547012e-15
3 6.716849298982197e-15
4 4.496403249731884e-15
5 7.105427357601002e-15
6 3.3306690738754696e-15
7 1.8318679906315083e-15
8 2.1649348980190553e-15
9 1.1102230246251565e-15
# Check eigendecomposition
plot_matrices([Q@np.diag(lam)@np.linalg.inv(Q) - A])

# and the inverse
plot_matrices([Q@np.diag(1/lam)@np.linalg.inv(Q) - np.linalg.inv(A)])
<Figure size 640x480 with 0 Axes>
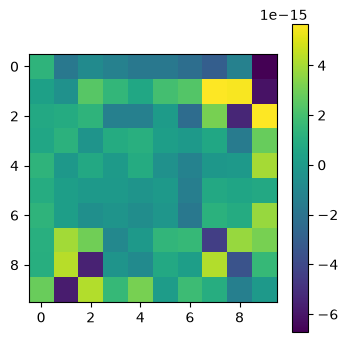
<Figure size 640x480 with 0 Axes>
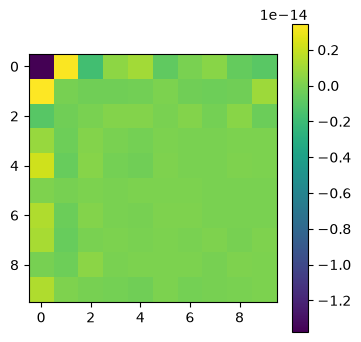
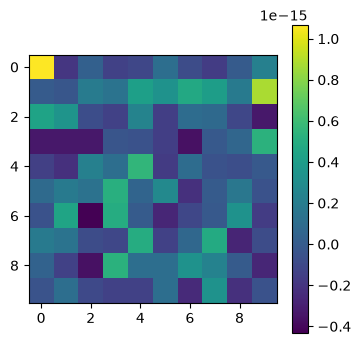
plot_matrices([np.linalg.inv(Q) - Q.T])
<Figure size 640x480 with 0 Axes>
Singular value decomposition (SVD)#
The singular value decomposition (SVD) of a \(m\times n\) matrix \(\mathbf{A}\) is
where
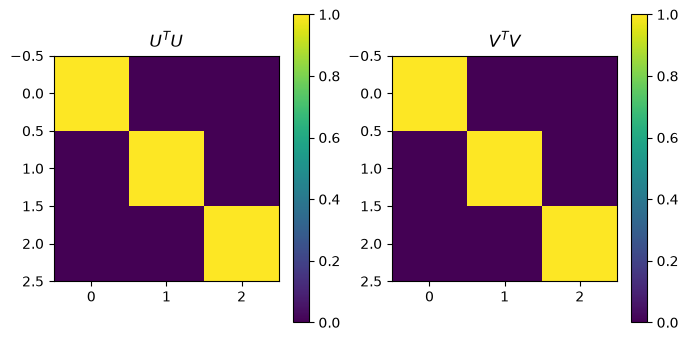
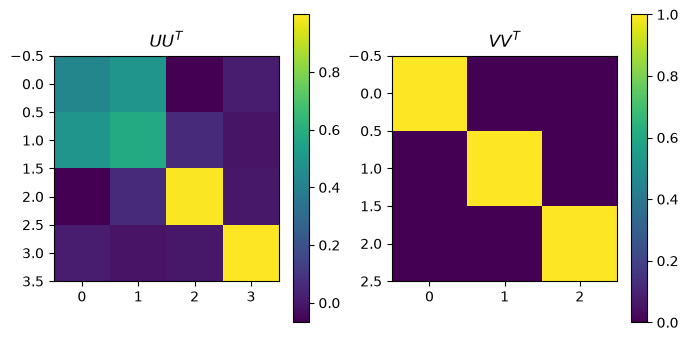
\(\mathbf{U}\) is an \(m\times n\) matrix with orthonormal columns
\(\mathbf{S}\) is an \(n\times n\) diagonal matrix whose diagonal elements are the singular values of the matrix \(s_i\)
\(\mathbf{V}\) is an \(n\times n\) orthogonal matrix (\(V^TV = VV^T = 1\))
If we have a square matrix (\(m=n\)), we can write the inverse as
m=4; n=3

A = np.random.rand(m*n).reshape(m,n)

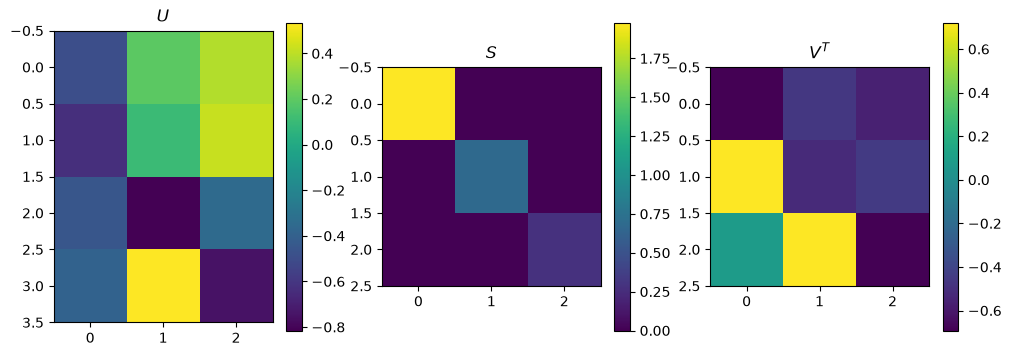
U, Sdiag, VT = np.linalg.svd(A, full_matrices=False)
print("Singular values are: ", Sdiag)

S = np.diag(Sdiag)
plot_matrices([U, S, VT], titles=[r"$U$", r"$S$", r"$V^T$"])

# U and V should be orthogonal
plot_matrices([U.transpose()@U,VT@VT.transpose()], titles=[r"$U^TU$",r"$V^TV$"])
plot_matrices([U@U.transpose(),VT.transpose()@VT], titles=[r"$UU^T$",r"$VV^T$"])

# Check the reconstructed matrix
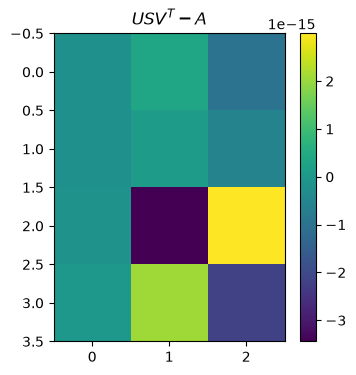
plot_matrices([U@S@VT - A], titles=[r"$USV^T - A$"])
Singular values are: [1.98057782 0.67548498 0.28583754]
<Figure size 640x480 with 0 Axes>
<Figure size 640x480 with 0 Axes>
<Figure size 640x480 with 0 Axes>
<Figure size 640x480 with 0 Axes>